By Founder & Lead Intelligence Analyst, Managa Risk Solutions
It’s usually a 2am Phone Call It’s usually a 2am phone call. A dispatcher tells you a truck has disappeared somewhere between the depot and its destination. The tracking unit has gone silent, the driver is unreachable, and operations staff immediately begin asking the same questions: where did it happen, what was the cargo, and could it have been prevented? After years of analysing organised freight crime, one lesson stands out. Truck hijackings are rarely random. They are planned operations carried out by organised groups that understand freight movements, driver behaviour, and vulnerable routes better than many organisations realise.
The National Picture
Managa Risk Solutions analysed 203 verified SAPS truck hijacking dockets recorded between 1 June and 30 July 2026. While this is only a two-month sample, the findings closely align with national crime trends. South Africa’s logistics industry contributes about 9–10% of GDP, supports over a million jobs, and moves billions of tonnes of freight every year. Organised cargo crime continues to impose significant costs through stolen cargo, business interruption, insurance claims, and rising security expenditure. SAPS recorded 420 truck hijackings in a single quarter of 2025 nationally; even after a 15.5% decline to 349 cases in Q3, Gauteng still accounted for 64% of that total, almost identical to the concentration we see in our own sample. Industry estimates from SABRIC and the Road Freight Association put the annual economic cost of truck hijackings between R2 billion and R6 billion once cargo losses, insurance premium increases, and security spend are factored in. The South African Insurance Crime Bureau separately estimates the figure at roughly R3 billion a year, driven mostly by cargo loss. TAPA’s most recent monitoring period recorded R577 million in direct cargo losses across 2,670 incidents over eighteen months almost certainly an undercount, since only a small share of reported cases disclose a financial value at all. The goods most consistently targeted are the ones that move fastest on the secondary market: electronics, copper, tyres, cigarettes, liquor, fuel, and groceries.
Where the Threat is Concentrated
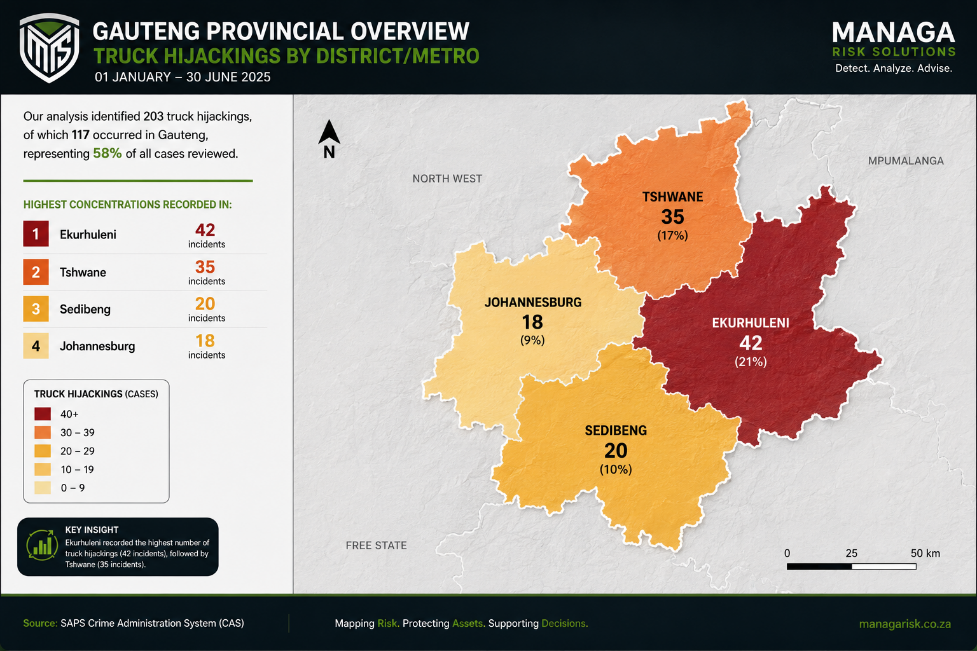
Our analysis shows that truck hijackings remain heavily concentrated in Gauteng, which accounted for 117 of the 203 incidents (58%) recorded during the study period. This reflects the province’s position as South Africa’s primary logistics and distribution hub, where major freight corridors converge. KwaZulu-Natal ranked second with 30 incidents (15%), followed by Mpumalanga and North West. Within Gauteng, Ekurhuleni (42 cases) and Tshwane (35 cases) emerged as the highest-risk districts, highlighting the continued vulnerability of industrial zones and major transport corridors. These findings reinforce the need for intelligence-led route planning and targeted security measures in identified hotspot areas rather than a uniform national approach. Recurring hotspots include Orange Farms, Atteridgeville, Olifantsfontein, Kempton Park, Alberton, and Akasia. These areas are not random. They sit close to distribution centres, industrial parks, and major highways allowing syndicates to intercept vehicles and quickly move stolen cargo before a response can be mobilised.
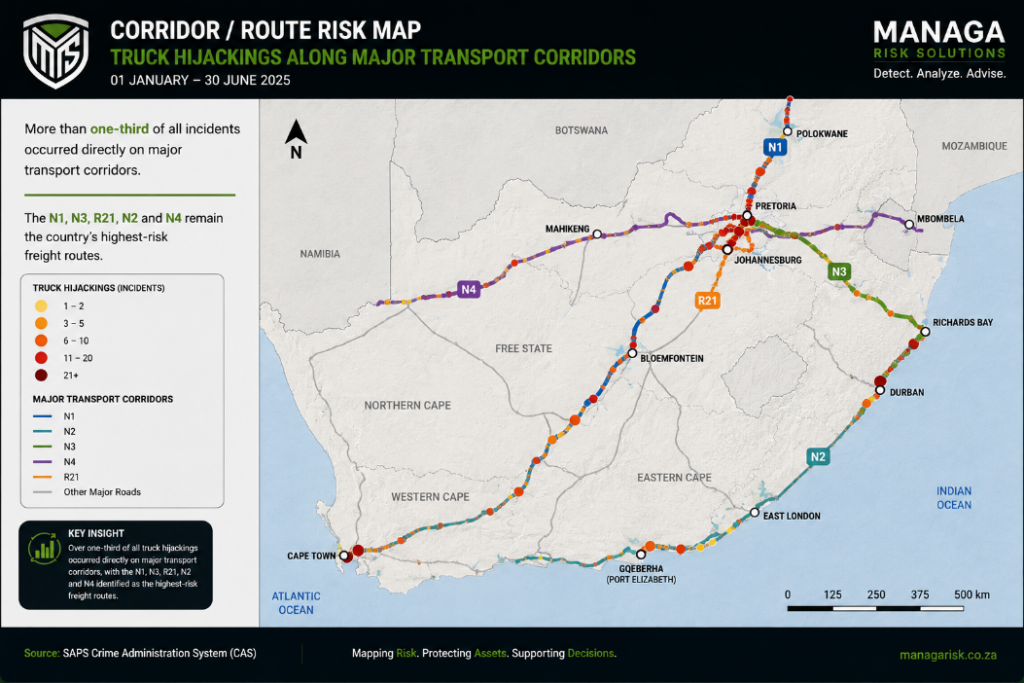
That highway proximity shows up directly in the address data: 37% of all cases (76 of 203) happened on a named national or regional route. Hijacking cases by route The N1 (19 cases) and N3 (14 cases) dominate, followed by the R21 (7), N2 (6), and N4 (5). The N1 and N3 are the two primary arteries connecting Gauteng to the rest of the country’s freight network; the R21 runs past OR Tambo International, another high-volume corridor. Route risk is not evenly distributed even within a high-risk province a truck on a quiet secondary road faces meaningfully different odds than one on the N1 or N3 during a midweek freight window.
How Hijackings Unfold
Most incidents followed the same operational sequence: surveillance, target selection, interception, driver control, vehicle relocation, and cargo offloading. Typical hijacking sequence
Weapon and method. Firearms featured in the large majority of incidents, pistols and revolvers
Specifically in 151 of 203 cases with the primary method in 124 cases simply being a firearm pointed at the driver to force immediate compliance. Instrument used in hijacking cases Driver control. This is where the case narratives reveal more than the structured data alone. Fake police or traffic stops , suspects using blue lights, unmarked vehicles, or traffic officer uniforms to get a driver to pull over voluntarily appear in an estimated 76 of the 203 case narratives, making it one of the most common interception tactics in the dataset. Once stopped, drivers were frequently removed from their vehicles: 64 cases explicitly describe the driver being taken from the scene, and 35 describe the driver being tied up and/or blindfolded before being dropped in an informal settlement or open veld, often some distance from where the truck itself was taken.
Driver control tactics
Timing: Wednesday, Thursday, and Friday together account for 128 of 203 cases (63%) a clear midweek concentration that lines up with peak freight volume. Cases by day of week a representative scenario. A truck departs a depot on Gauteng’s East Rand on a Thursday morning, running a route it has driven for months. Along a highway offramp, a vehicle displaying blue lights signals it to pull over. The driver complies, believing it to be a routine stop. Once stopped, armed suspects take control, remove the driver from the cabin, and in many cases blindfold and drive him to a separate location before releasing him while a second team relocates the truck and begins offloading the cargo. By the time the incident is reported, the vehicle is already off the main road network and no suspect has been identified. That sequence, more than any single unusual case, describes the majority of what’s in this dataset.
Three Intelligence Findings
1. Truck hijackings are geographically concentrated rather than evenly spread within Gauteng,
within specific districts, and along a handful of specific highways.
2. Predictable routes and schedules create predictable targets. Fixed departure times and unchanging routes are what make effective surveillance possible in the first place.
3. Organised syndicates continually adapt and exploit operational weaknesses from fake police stops to GPS jamming and coordinated offload logistics rather than acting opportunistically.
Why Traditional Security Measures Often Fail
Many organisations invest heavily in cameras, vehicle tracking, and armed response. These remain important, but they are often activated after the hijacking has already occurred , a tracker that confirms a truck is gone doesn’t prevent it from being taken. Intelligence changes the timeline by identifying emerging threats, hotspot corridors, and evolving criminal tactics before an incident takes place, shifting the posture from recovery to prevention.
Operational Implications
For fleet operators:
Vary routes and departure times where practical predictability is the single biggest asset a syndicate has, and it costs nothing to disrupt.
Treat Wednesday–Friday as a heightened-risk window, particularly on the N1, N3, R21, N2, and
N4. Strengthen driver awareness of fake police and traffic stops. Given how frequently this tactic
appears in the data, drivers need a clear, rehearsed protocol for verifying a stop before pulling over confirming via dispatch, looking for proper vehicle markings, and treating an isolated stop request with more caution than one at a visible, populated location.
- Use tracking systems as real-time decision support tools, not just recovery tools — geofencing alerts and a monitored control room turn a tracker into an early-warning system rather than a post-incident record.
- Score routes for risk, not just distance and fuel, and treat ramps, tollgates, and interchanges as
- Higher-alert zones than open highway.
- Vet and rotate drivers on high-risk routes, since inside knowledge of schedules and cargo value is a documented enabler of targeted attacks.
For drivers:
Compliance with an armed instruction is the correct response cargo and vehicles are
Insured, drivers are not. Verify any stop that isn’t at a clearly marked, official checkpoint before pulling over, especially on isolated stretches of highway.
Vary stopping points for fuel, food, and rest. Report suspected surveillance immediately, and know your panic and tracking systems well enough to use them under stress.
For insurers, mining, and retail operators:
Insurers can use hotspot and corridor intelligence to improve underwriting and risk-based premiums rather than relying on generic regional ratings.
Mining and retail companies moving high-value goods along known corridors should incorporate
route intelligence directly into supply-chain planning, not treat it as a security afterthought.
Looking Ahead
Organised freight crime will continue to evolve through better planning, insider information, and
Technology. Companies that depend solely on physical security will remain vulnerable. Those that combine operational security with current intelligence will be far better positioned to reduce losses.
Conclusion
Truck hijackings are intelligence-driven crimes. The same patterns that allow criminals to plan successful attacks predictable routes, midweek timing, known chokepoints, a reliable driver-control tactic also allow organisations to anticipate and reduce risk.
At Managa Risk Solutions, we help clients transform crime data into actionable intelligence through early warning alerts, route risk assessments, hotspot mapping, and modus operandi analysis. In today’s operating environment, intelligence is no longer a competitive advantage it is an operational necessity.
Founder & Lead Intelligence Analyst, Managa Risk Solutions
📞 067 712 8472 | ✉ info@managarisk.co.za |
📍Pretoria, South Africa
Data source: South African Police Service case records, June–July 2026 (203 cases across 171 distinct locations in 115 police station areas, geocoded to suburb/street level where address data was available). Driver-control tactics identified through review of case narrative text. Broader industry context drawn from publicly reported SAPS crime statistics, SABRIC, the Road Freight Association, TAPA EMEA, and the South African Insurance Crime Bureau. Individual victim
names and contact details excluded from this analysis.